
Log Report Automation
A local Python CLI that converts structured CSV service logs into validated, stakeholder-friendly Excel reports.
Overview
A public automation project focused on repeatable operational reporting and explicit data-quality feedback.
Problem / motivation
Raw CSV logs require validation, analysis and careful presentation before they become reliable reporting artifacts.
What it implements
- Validate input with strict and lenient modes and actionable command-line summaries.
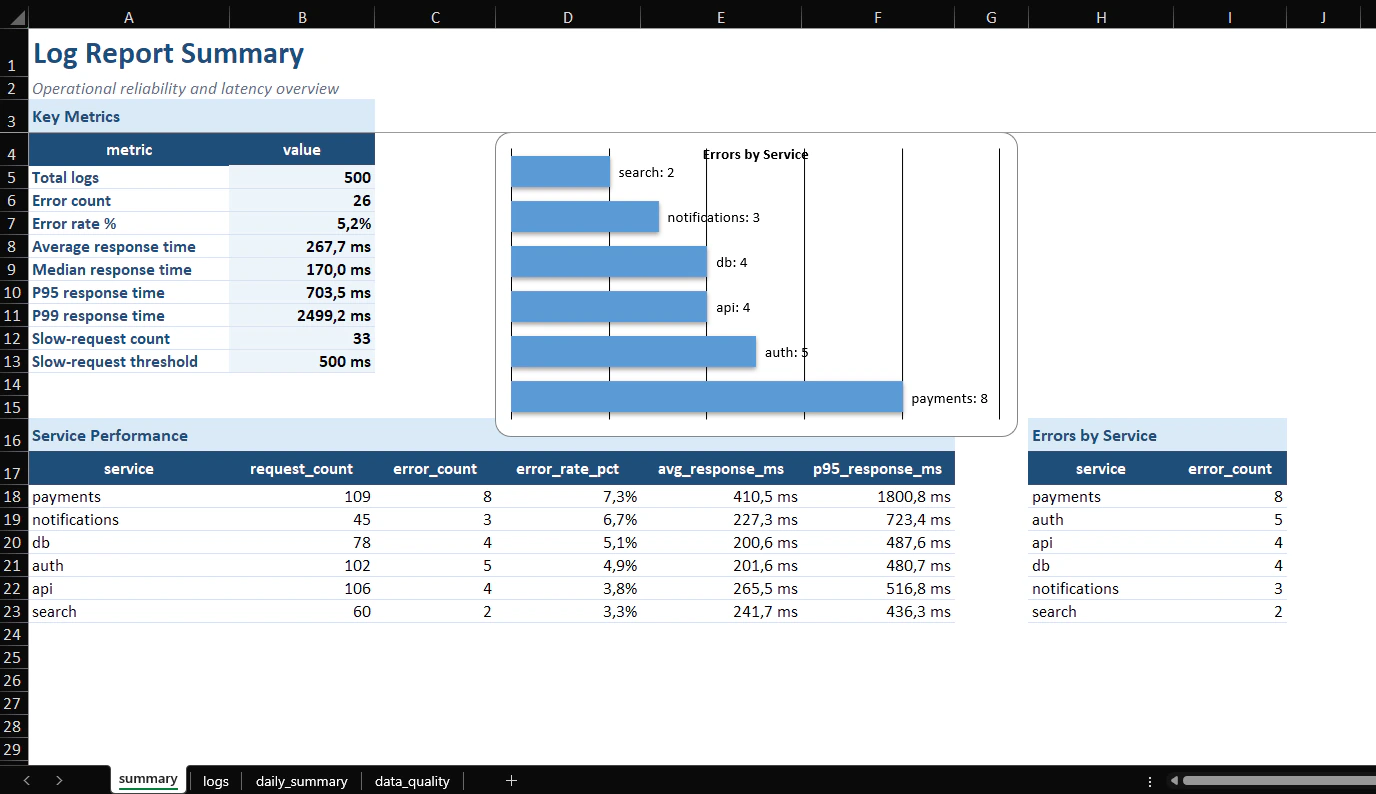
- Calculate reliability metrics including error rates and P95/P99 response times.
- Generate formatted Excel worksheets and charts while protecting untrusted text from formula execution.
Architecture / workflow
- The CLI reads structured CSV logs and applies strict or lenient validation before analysis.
- Validated records feed reliability calculations, including error rates and response-time percentiles.
- The reporting layer writes formatted Excel worksheets, charts and explicit data-quality findings.
Key engineering decisions
Command-line workflow
A CLI keeps report generation repeatable, scriptable and easy to validate in CI.
Treat spreadsheet output as a security boundary
Potential formula input is handled explicitly before data is written to Excel.
Reliability / security considerations
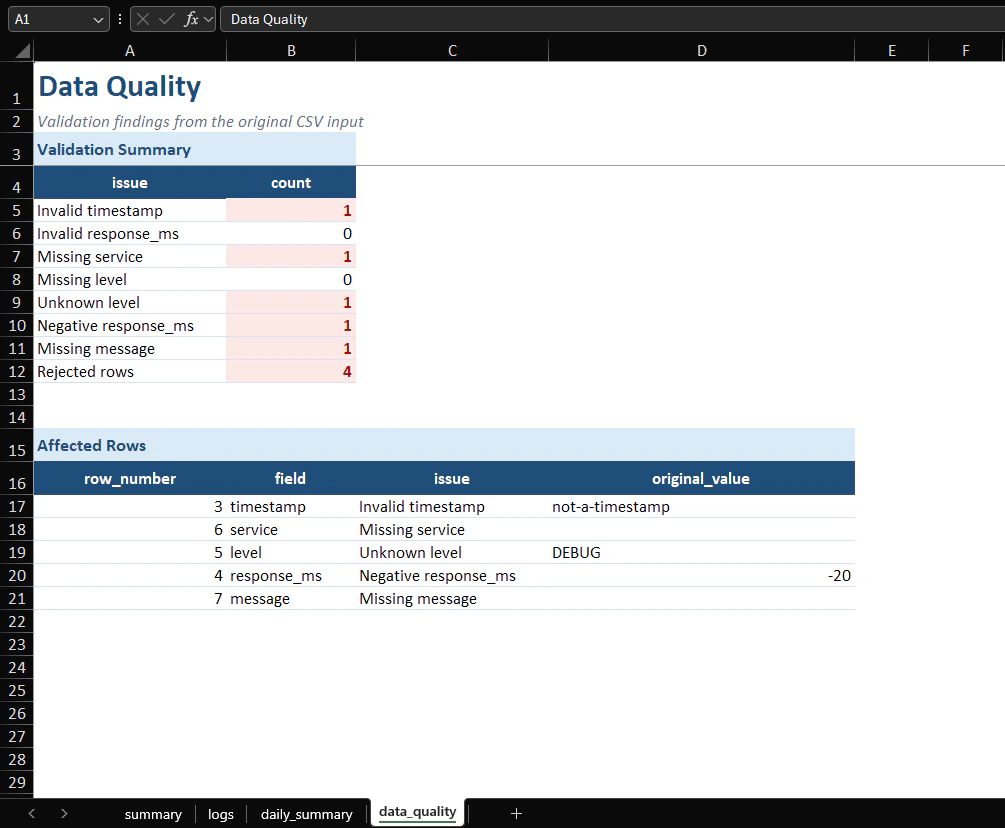
- Validation failures remain visible instead of silently disappearing from the report.
- Untrusted text is handled before workbook output to reduce spreadsheet formula-execution risk.
- A command-line interface makes the same transformation repeatable in local scripts and CI.
Validation / testing
- pytest covers the report-generation path and its data-handling behaviour.
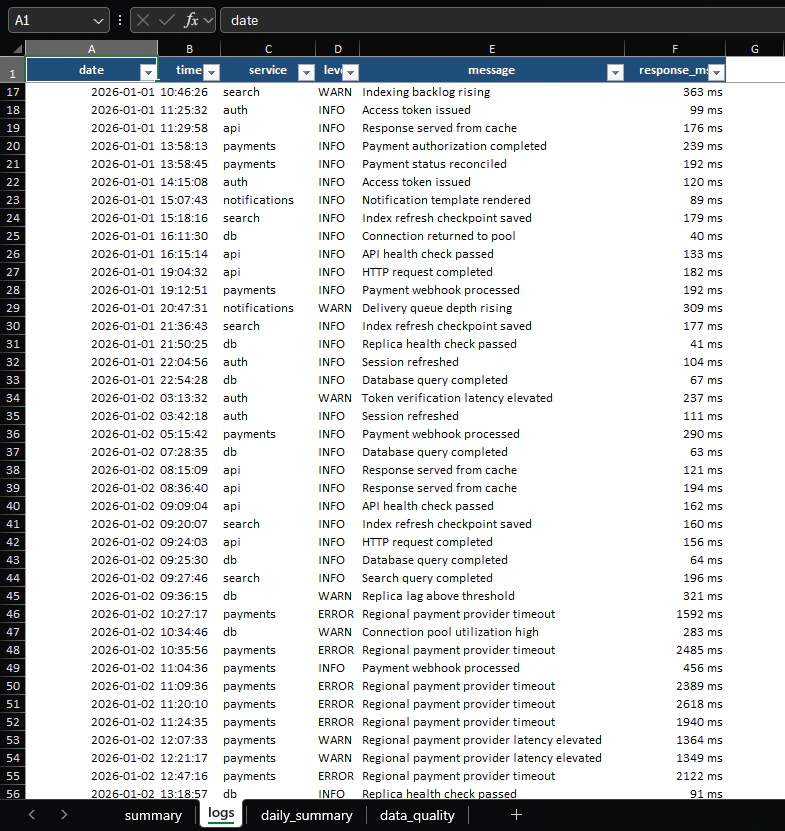
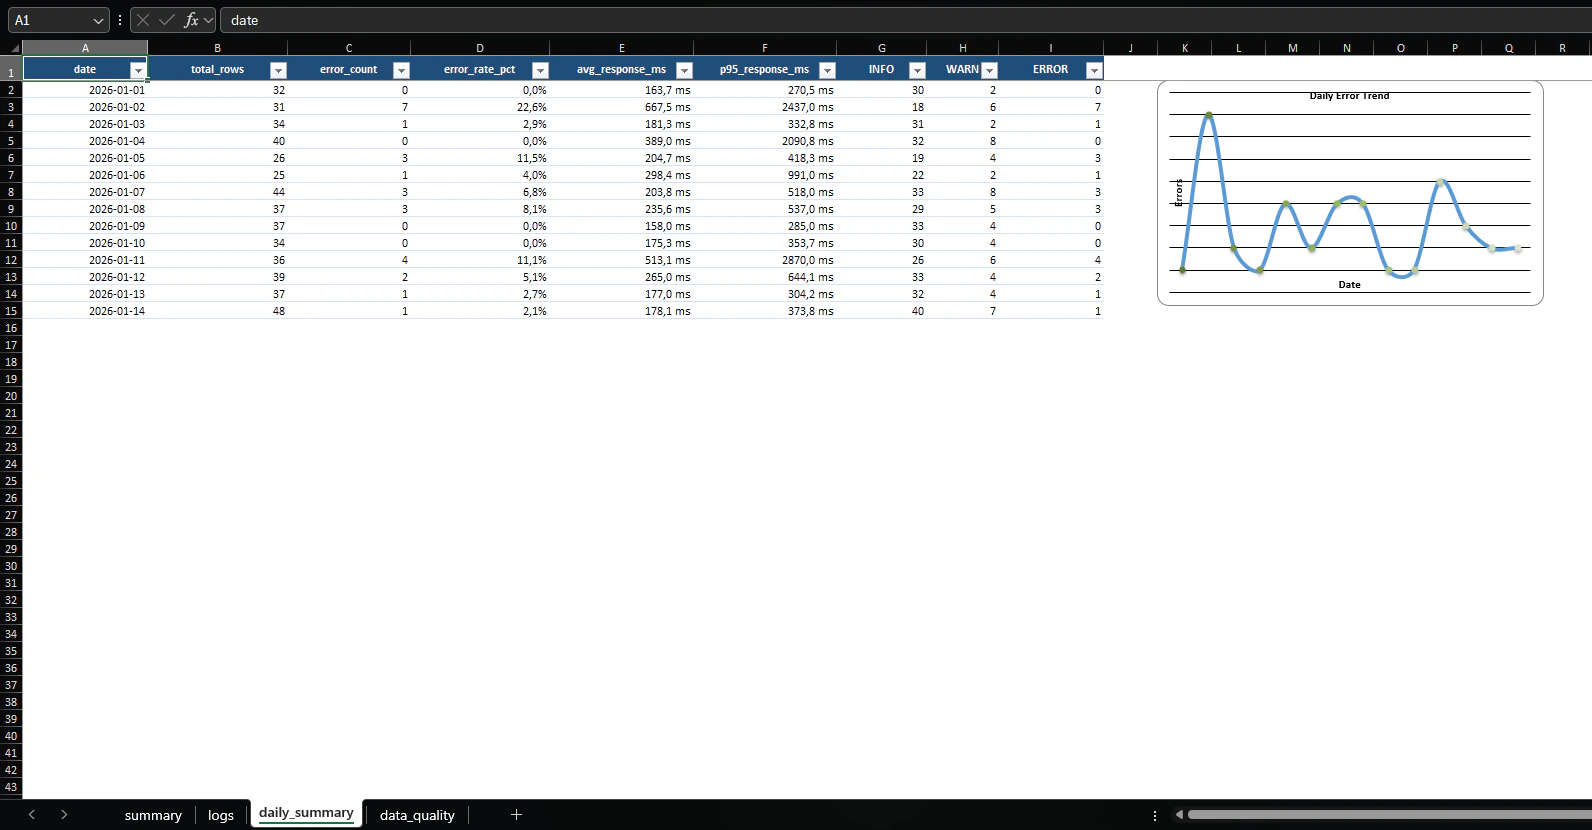
- Generated workbooks are checked through summary, detail, trend and data-quality views.
- GitHub Actions provides automated validation for the public repository.
Project evidence
Screenshots / results
Verified output from Log Report Automation, presented with the operating boundaries described on this page.
Outcomes
- Completed the intended v1 path from validated operational logs to tested Excel reports.
Current scope / limitations
The completed v1 is a local batch-reporting utility. It produces Excel artifacts from supplied CSV data; it is not a live monitoring platform, database or hosted analytics service.